wizzy

[ PROJECT ]

AI-powered HVAC decision system
for small business owners

자영업자를 위한
AI 기반 HVAC 의사결정 시스템

CONCEPT PROJECT

ROLE 역할

Product Designer

프로덕트 디자이너

MY ROLE 기여

Pricing-structure & context analysis (lead) · Usability test moderation · System design (co-led) · User research (support)

요금구조·맥락 분석 리드 · 사용성 테스트 진행 · 시스템 설계(공동) · 리서치 참여

SKILLS 스킬

Cost-structure analysis · UT moderation · Data-informed design · AI-assisted visualization

비용 구조 분석 · UT 모더레이션 · 데이터 기반 디자인 · AI 이미지 생성 비주얼라이제이션

DURATION 기간

7 weeks

7주

TEAM

2 designers

디자이너 2명

TYPE 성격

Concept project

컨셉 프로젝트

[ 01 — OVERVIEW ]

01

— 시작점 — Start point

여름철만 되면 냉방비에 대한 이슈가 반복됩니다. Every summer, the same cooling-cost issue keeps coming back.

전기요금을 줄이기 위한 다양한 방법들이 공유되지만,
실제 환경에서는 이를 어떻게 적용해야 할지 명확하지 않습니다
Plenty of tips for cutting bills get shared, but in real environments
it's never clear how to actually apply them.
02

— 시작점 — Start point

그렇다면, 왜 사람들은 냉난방을 명확한 기준 없이 조절하고 있을까요? So why do people adjust HVAC without any clear criteria?

03

— 타깃 — Target

타겟 선정을 위해 비용 영향과 현재 해결 여부를 기준으로 세 가지 후보를 비교했습니다. To choose a target, I compared three candidates by cost impact and whether the problem is already solved today.

가정 Households

  • 낮은 사용량 Low consumption
  • 비용 영향 낮음 Low cost impact
  • 별도 관리 시스템 없음 No dedicated management system

대형건물 Large buildings

  • 높은 사용량 High consumption
  • 비용 영향 큼 High cost impact
  • EMS 관리시스템 존재 EMS in place
  • 이미 관리 및 최적화가 이뤄지는 영역 Already managed and optimized

자영업자 매장 Small business stores

  • 높은 사용량 High consumption
  • 비용 영향 큼 High cost impact
  • 별도 에너지관리 시스템 없음 No dedicated energy management system
  • 개별 판단에 의존 Reliant on individual judgment

04

— 타깃 — Target

자영업자 매장을 타깃으로 설정했습니다. I set small business stores as the target.

가정과 비교해 비용 기준에서 차이가 크게 발생하며, 아직 명확한 해결 기준이 없는 영역이기 때문입니다. The cost gap versus households is significant, and there's still no clear solution baseline in this space.

05

— 검증 — Validation

저 역시 매장을 운영하며 이 문제를 직접 겪고 있었습니다.

이 문제가 개인적인 사례에 그치지 않는지 확인하기 위해, 사용자 리서치를 진행했습니다.
I'd been living this problem myself while running a store.

To check that it wasn't just my personal case, I ran user research.

[ 02 — RESEARCH ]

[ 02.1 — SECONDARY RESEARCH ]

Without clear criteria for when or how to adjust HVAC,
small business owners kept anxiously changing the settings

냉난방을 언제, 어떻게 바꿔야 할 기준이 없어,
자영업자는 불안해서 계속 설정을 바꾸고 있었다

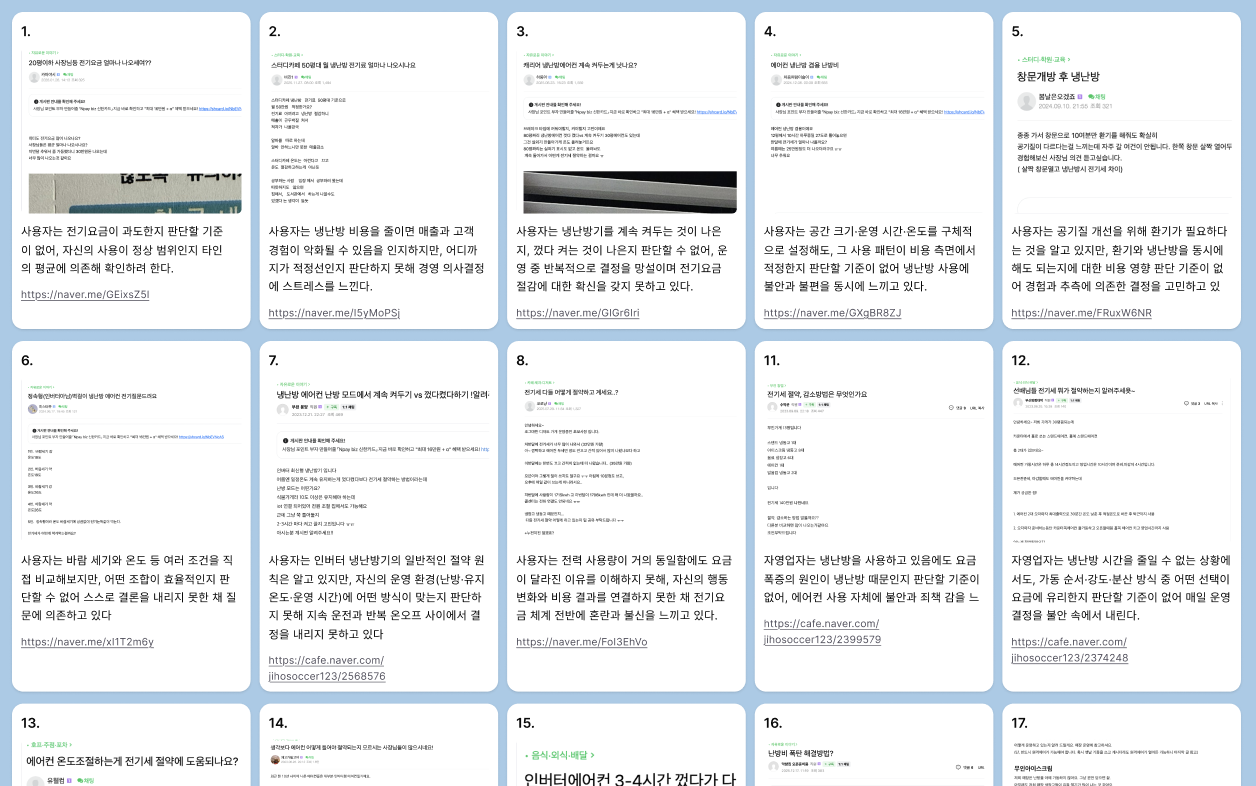
Analyzing community data revealed recurring patterns.

자영업자 커뮤니티 데이터를 분석한 결과 다음과 같은 패턴이 반복적으로 나타났습니다.

Collected community posts
Collected community posts 커뮤니티 데이터 게시글 모음
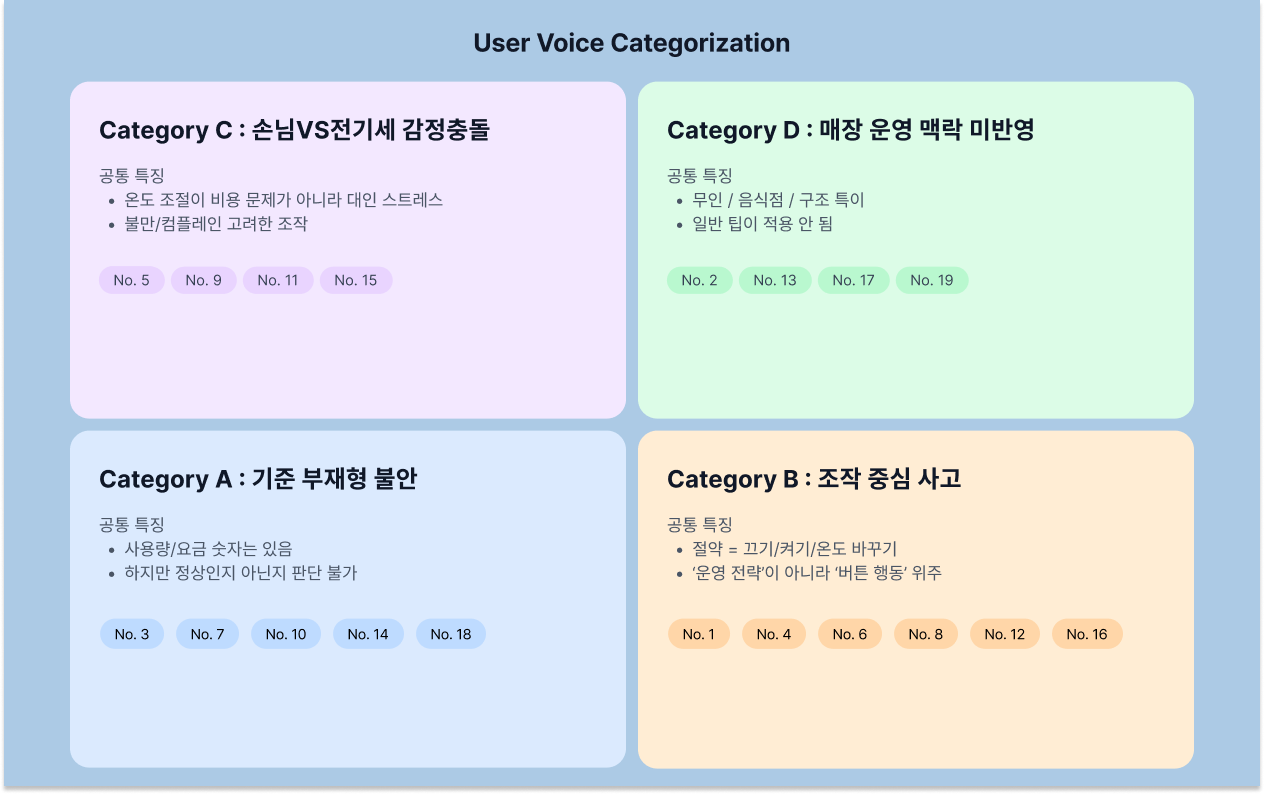
Categorized community data analysis
Categorized community data analysis 커뮤니티 데이터 카테고리화 분석

Pattern

01

기준 부재로 인한 반복 조정 Repeated adjustments from missing criteria

기준이 없어 불안할 때마다 냉난방을 계속 바꾸게 된다 Without criteria, anxiety drives constant HVAC tweaking

02

쾌적함 vs 비용 사이의 고민 Caught between comfort and cost

쾌적하게 유지하고 싶지만, 비용이 걱정돼 계속 고민하게 된다 Wanting comfort but worried about cost, the deliberation never stops

03

매장별 상황 차이로 인한 사용 포기 Abandonment from store-specific complexity

매장마다 상황이 달라 조작 방법을 맞추기 어려워, 결국 사용을 포기하게 된다 Each store's setup differs, adapting controls becomes too hard, they give up

04

판단보다 조작에 의존하는 행동 Acting first, judging never

어떻게 판단할지보다, 일단 조작으로 해결하려고 한다 Rather than weighing the decision, they jump straight to manipulating the controls

Observation

자영업자들은 쾌적하게 유지하고 싶지만 비용이 부담돼 스트레스를 받고 있었고,
비용을 아끼면서도 매장을 유지하기 위해 계속 어떻게 조작할지 고민하고 있었다
Operators wanted to keep stores comfortable but were stressed by the cost,
and they kept deliberating how to control the system to save money while keeping the store running.

[ 02.2 — PRIMARY RESEARCH ]

Behind the constant setting changes,
lay anxiety over cost and the absence of judgment criteria

기준이 없어 계속 설정을 바꾸는 문제 뒤에는,
비용에 대한 불안과 판단 기준의 부재가 있었다

Interview

To understand when stress peaks in real store operations and what actually drives HVAC decisions,
we interviewed 5 small business owners.

실제 매장 운영 상황에서 언제 스트레스가 커지는지, 무엇을 기준으로 냉난방을 조절하는지
구체적으로 알아보기 위해 자영업자 5인을 인터뷰했습니다

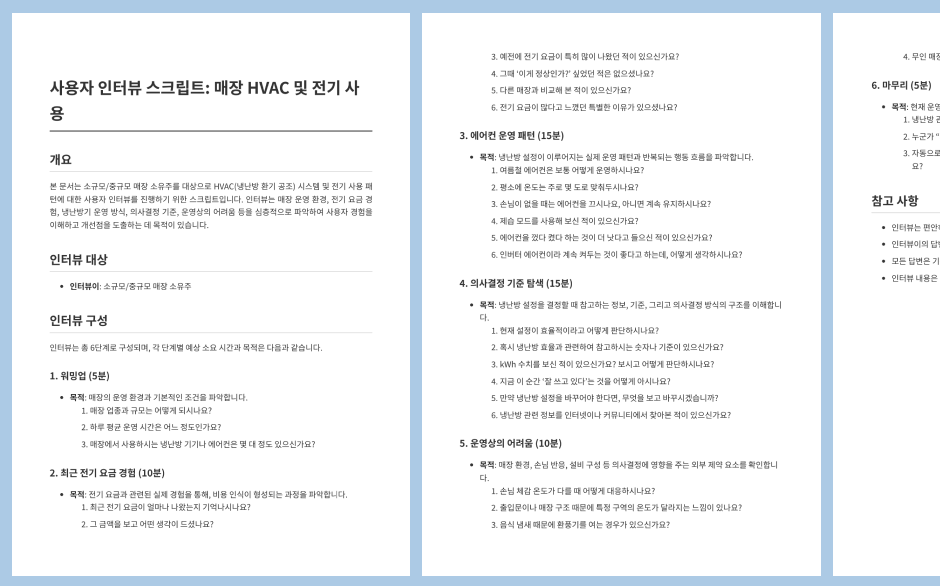
Interview protocol
Interview protocol 인터뷰 프로토콜

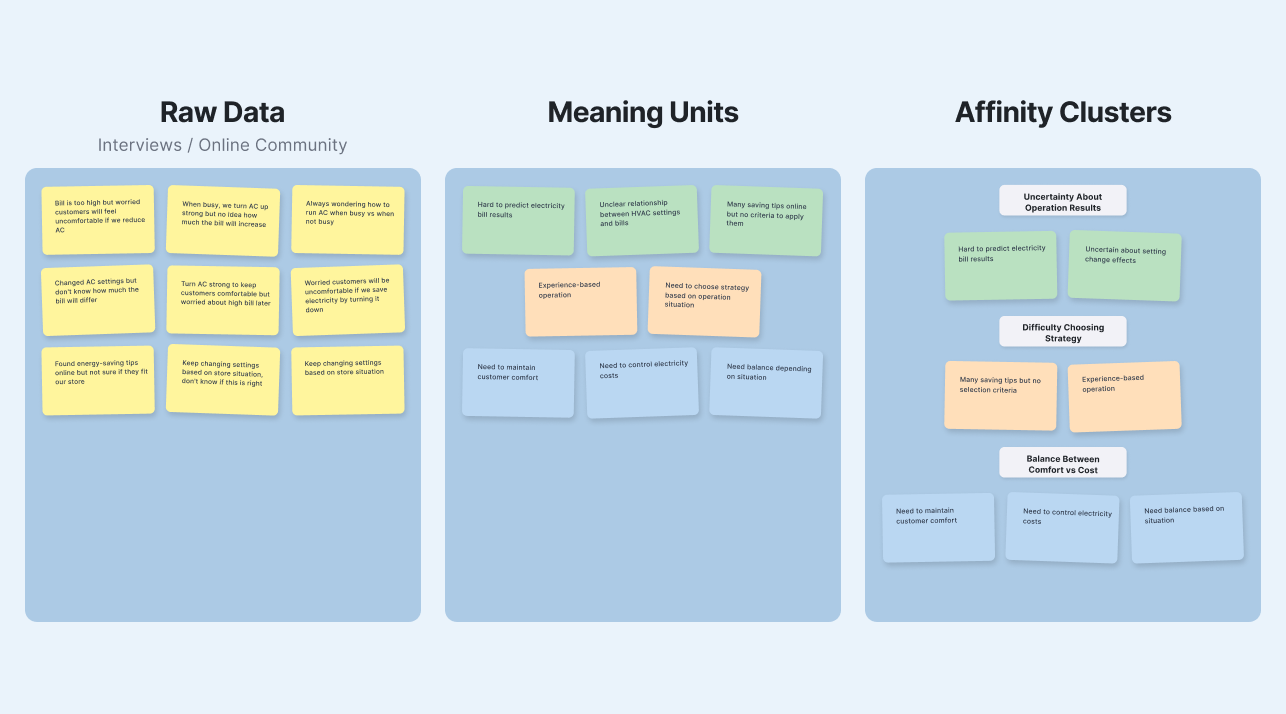
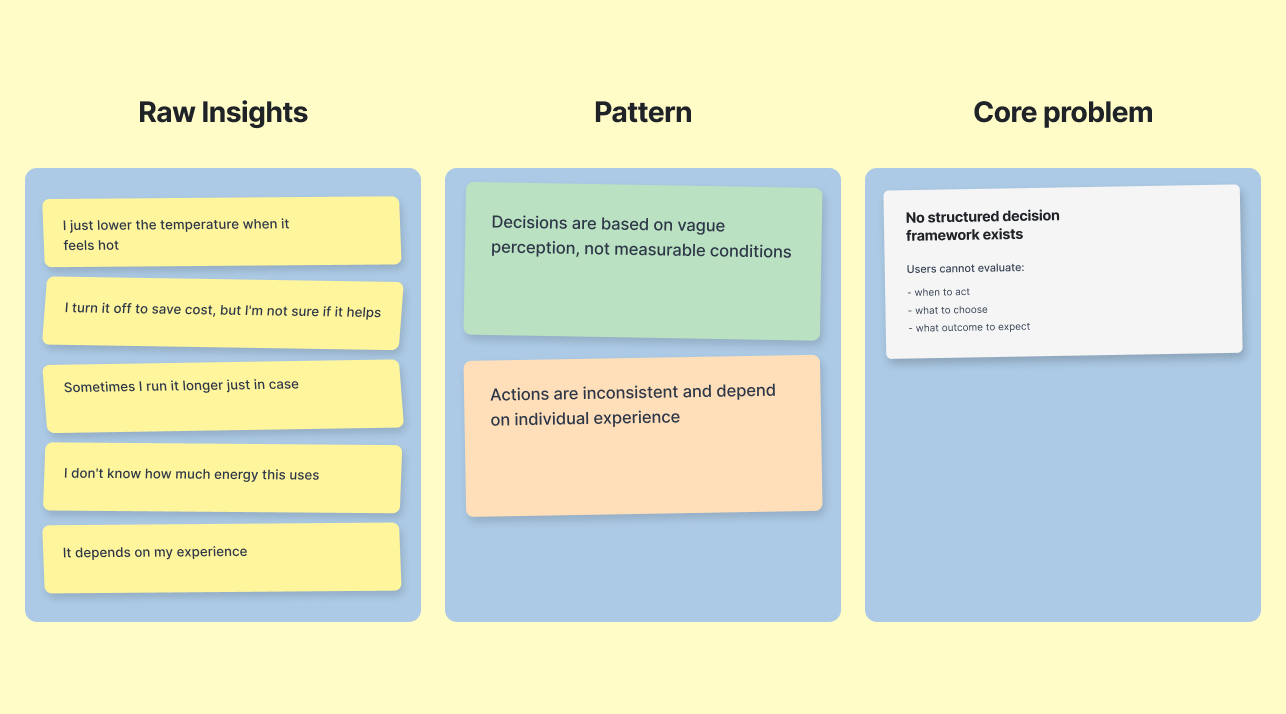
Data Analysis

After organizing the interview data through affinity mapping and thematic coding, similar concerns kept surfacing.

이 인터뷰 내용을 어피니티 맵핑과 Thematic coding을 통해 데이터를 정리해보니 비슷한 고민들이 이어지고 있었습니다

Affinity mapping
Affinity mapping 어피니티 맵핑
Thematic coding
Thematic coding Thematic coding

Findings

01. 결과를 알 수 없어 불안하다. 01. Anxiety from not knowing the outcome

설정을 바꿔도 전기요금이 얼마나 달라지는지
알 수 없어 불안해한다.
Even after changing the settings,
they can't tell how much the bill will shift, so anxiety lingers.

02. 상황마다 다르게 대응하지만 기준이 없다 02. They adapt to each situation, but without any criteria

바쁠 때와 한가할 때 다르게 조절하지만,
어떤 방식이 맞는지는 알지 못한다.
They adjust differently when busy or quiet,
yet they don't know which approach is right.

03. 그래서 직관에 의존하게 된다. 03. So they fall back on intuition

결국 느낌이나 경험에 따라 계속 설정을 바꾸게 된다. In the end, they keep changing settings based on feel or past experience.

Insight

No matter how often they change the settings, results aren't visible right away,
and the bill only arrives a month later — so operators keep adjusting with constant anxiety.
아무리 설정을 바꿔도 결과는 바로 확인할 수 없고,
고지서는 한 달 뒤에 나오기 때문에 자영업자는 불안을 안고 계속 바꾸게 된다

[ 02.3 — CONTEXT RESEARCH ]

Cost mattered most — but the actual pricing structure
was hard to understand and judge.

비용이 중요했지만, 실제 요금구조는
쉽게 이해하고 판단하기 어려웠습니다.

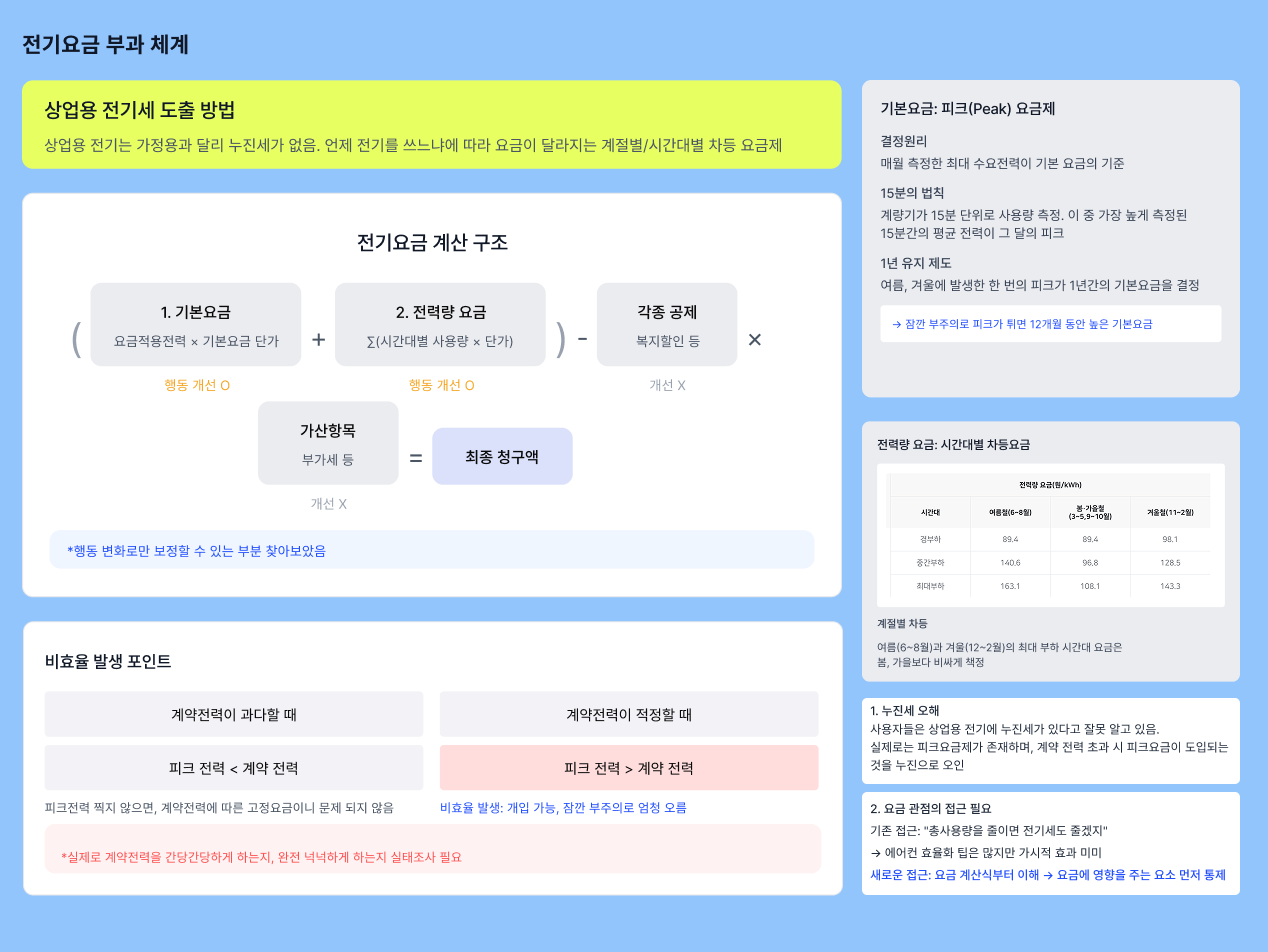
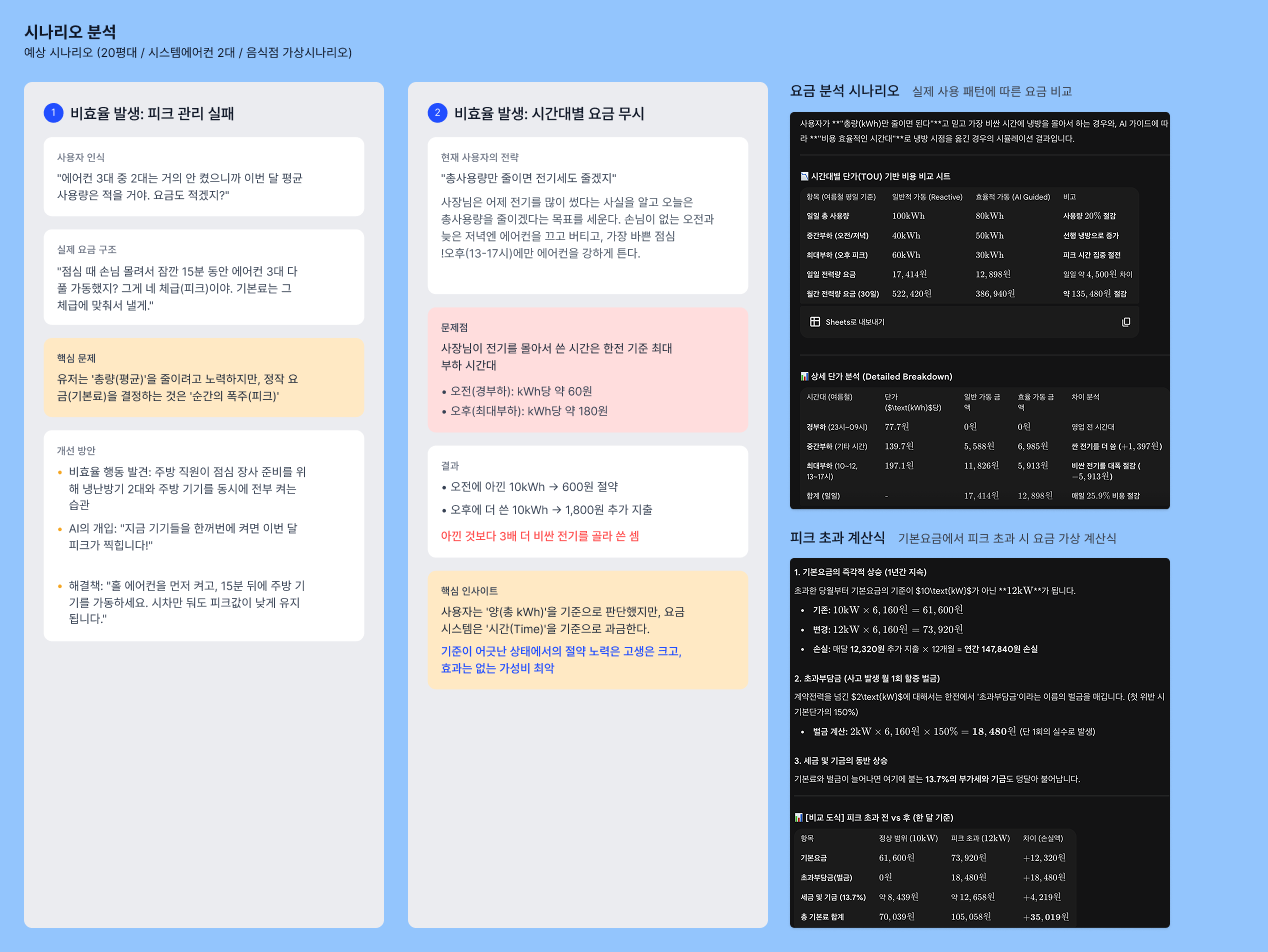
Pricing structure analysis
Pricing structure analysis 요금구조 분석 이미지

Energy Pricing Structure

The pricing structure analysis revealed multiple variables — peak / mid / off-peak time slots,
and progressive billing based on usage.

For busy small business owners, the pricing structure
was too complex to understand during operation.

에너지 요금 구조를 분석한 결과 피크 / 중간 / 경부하 시간,
사용량에 따른 누적 과금 등 여러 변수들이 존재했습니다

운영에 바쁜 자영업자가 요금 구조를 이해하기에는
과금 체계가 복잡한 상태였습니다

Scenario diagram
Scenario diagram 시나리오 이미지

Scenario Test — Try

We checked whether the cost structure alone could really reduce cost in actual operation.

To test this, we wrote a simple store-operation scenario
and applied cost-minimizing methods based on the pricing structure.

그래서 비용 구조만 잘 활용하면 실제 운영에서도
비용을 줄일 수 있는지 확인해봤습니다.

이를 위해 간단한 매장 운영 시나리오를 작성하고
요금 구조에 따라 비용을 최소화할 수 있는 방법을 적용해봤습니다.

Scenario Test — Result

As a result, adjusting based on time slots or usage
did reduce energy use.

But in real stores:
1) the cost-cutting criteria conflicted with the comfort criteria, and
2) the savings were smaller than expected.

그 결과, 시간대나 사용량을 기준으로 조절하면
에너지 사용을 줄일 수는 있었습니다.

하지만 실제 매장에서는
1) 비용을 줄이는 기준과 쾌적하게 유지하는 기준이 서로 충돌했고
2) 그리고 절감효과도 예상보다 크지 않았습니다.

Insight

비용만 기준으로는 실제 운영 문제를 해결할 수 없다는 것을 확인했습니다.
그래서 비용과 쾌적도를 함께 고려할 수 있는 기준이 필요했습니다.
We confirmed that cost alone can't solve real operation problems.
That's why we needed a criterion combining both cost and comfort.

[ 02.4 — COMPETITOR RESEARCH ]

Existing systems focused on precise state control,
so they didn't provide a way to judge which choice was better.

기존 시스템은 상태를 정확하게 제어하는 데 집중했기 때문에,
어떤 선택이 더 나은지 판단하는 기능까지는 제공하지 않았다

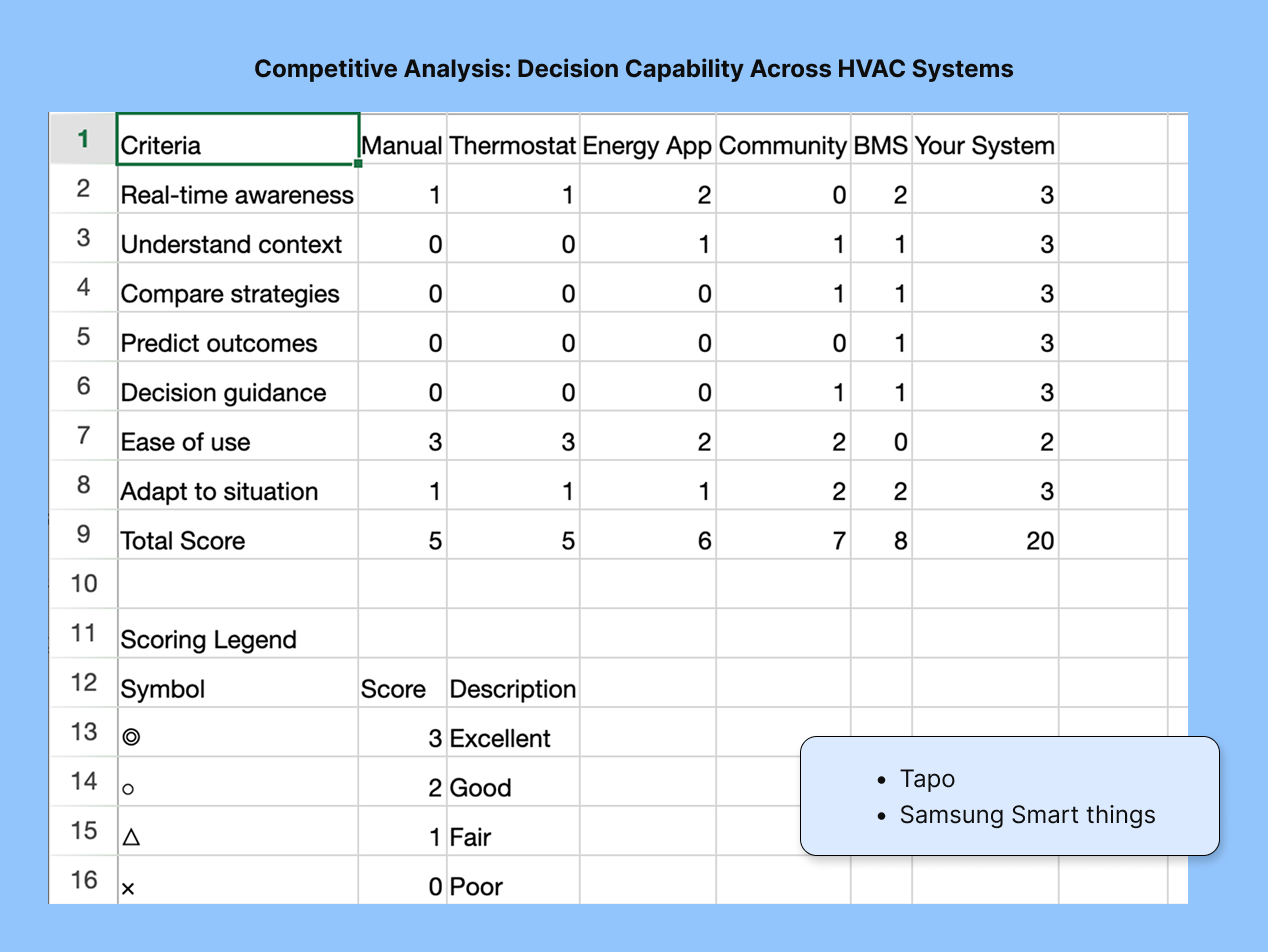
Competitor analysis spreadsheet
Competitor analysis spreadsheet 경쟁사 분석 엑셀

Existing HVAC systems were designed to clearly show the current state — temperature,
humidity — and to make adjustments easy.

But the purpose of these systems was closer to state control;
they didn't include a function for judging which choice was better.

기존의 냉난방 시스템은 온도와 습도 같은 현재 상태를 정확하게
보여주고 조작을 쉽게 할 수 있도록 설계되어 있었다.

하지만 이 시스템의 목적은 상태를 제어하는 것에 가까웠고
어떤 선택이 더 나은지 판단하는 기능까지는 포함되어 있지 않았다

In the end, with the systems that exist today, users had to read the data,
interpret it themselves, and judge by trying different settings repeatedly.

결국 현재 존재하는 시스템에서 사용자는 데이터를 보고
직접 해석하고, 여러 번 바꿔보면서 판단할 수밖에 없었다

냉난방 관리는 기기 제어의 문제가 아니라, 판단의 문제였습니다. Managing HVAC wasn't a control problem — it was a decision problem.

Problem statement

냉난방 설정을 바꾸는 선택전기요금 변화라는 결과가 연결되지 않아,
사용자는 자신의 조절이 비용에 어떤 영향을 주는지 알 수 없다
The choice to change HVAC settings and the resulting change in the electricity bill aren't connected,
so users can't tell how their adjustments affect cost.

[ 03 — APPROACH ]

[ 03.1 — DIRECTION SHIFT ]

So we shifted to an approach where AI judges
both cost and comfort together.

AI가 비용과 쾌적도를
함께 판단하는 방식으로 접근 방식을 바꿨습니다

Existing systems were designed around a single axis — comfort — making controls easier to operate.
But we focused on the fact that users still couldn't resolve the cost pain point,
so we approached the problem in a way that lets them judge cost and comfort together.

기존 시스템은 조작을 쉽게 만드는데 쾌적이라는 한 축을 중심으로 설계되었습니다.
하지만 우리는 유저가 비용이라는 페인포인트를 해결하지 못하고 있다는 점에 집중해
비용과 쾌적도를 함께 판단할 수 있는 방식으로 접근했습니다.

기존 Before

쾌적 1축 중심 Single axis — comfort only

Operator Operator

비용 + 쾌적 2축 통합 판단 Both axes — judged together

[ 03.2 — UNDERSTANDING THE CONTEXT ]

Operators had to make decisions fast, in the middle of busy operations.

자영업자는 바쁜 상황속에서, 빠르게 판단해야했습니다.

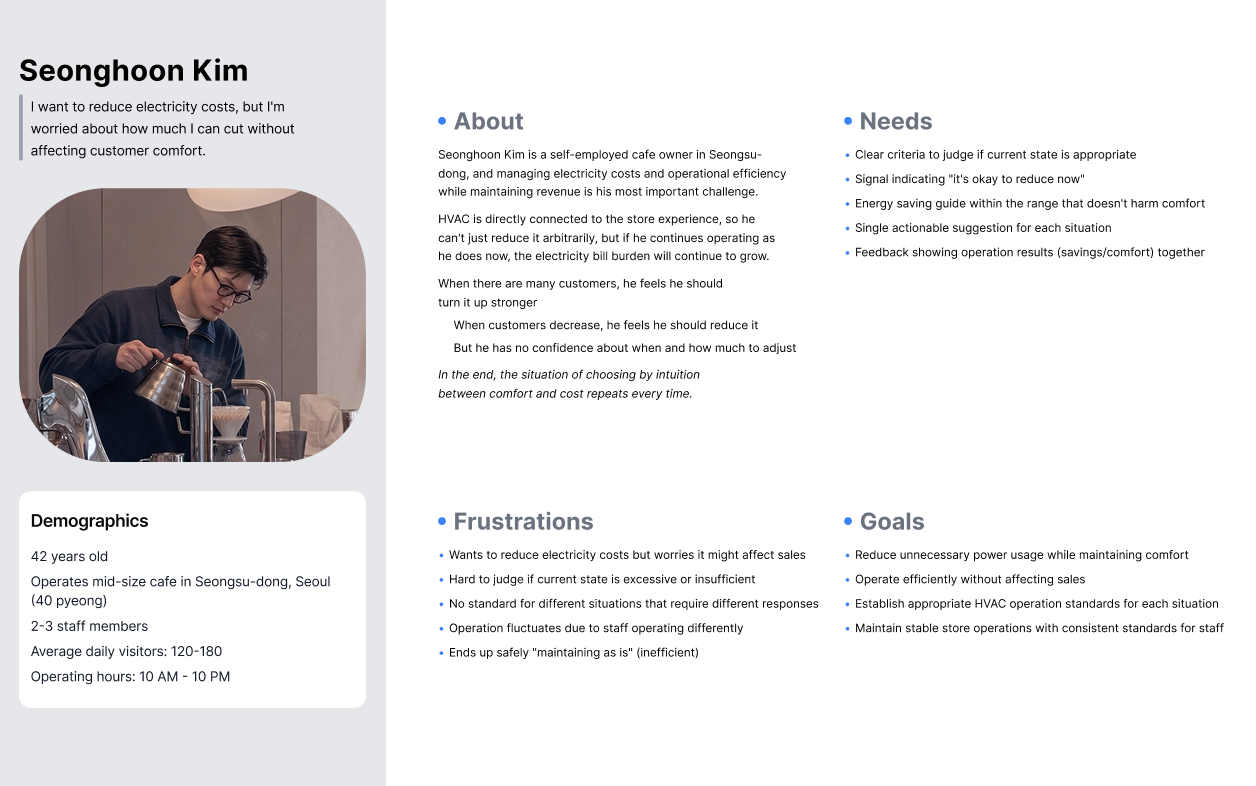
Persona
Persona 퍼소나
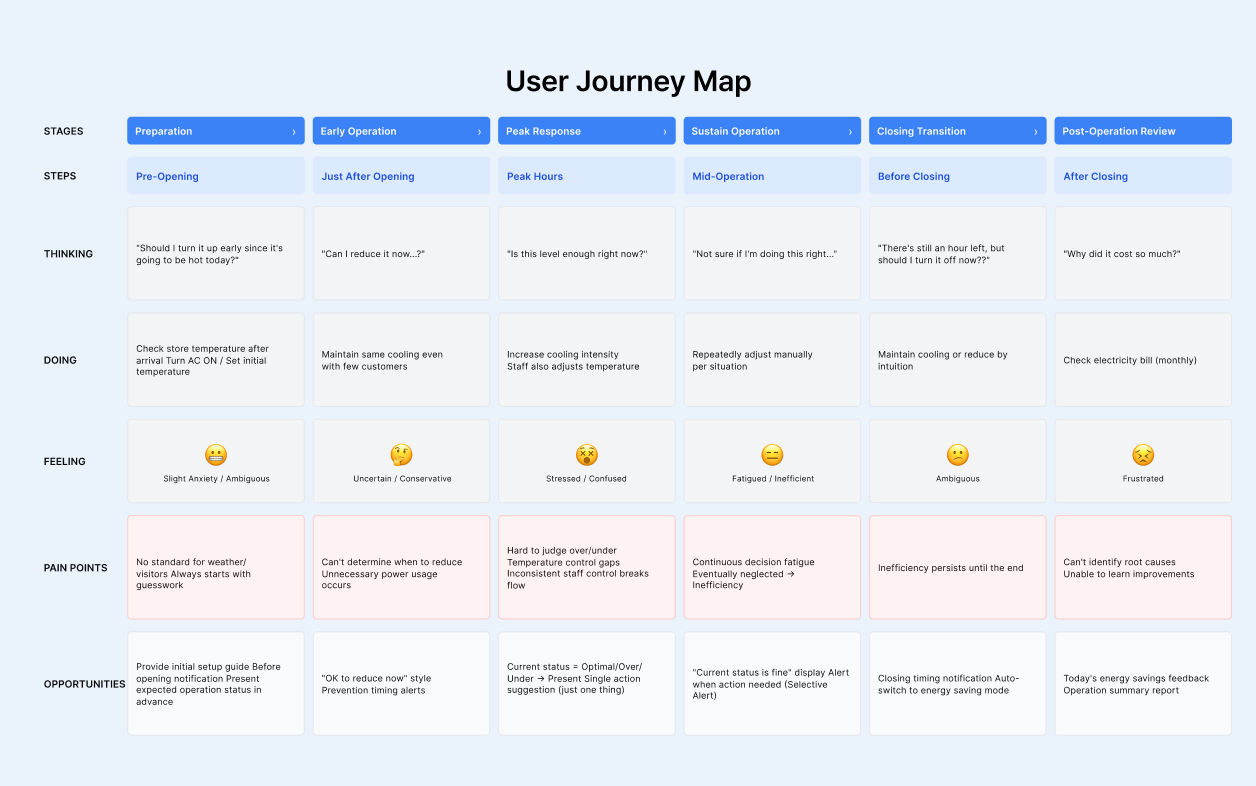
User Journey
User Journey 유저저니

To build a product that could realistically be adopted in store operations,
we set up user personas and walked through the operator's journey.

Operators were repeatedly adjusting HVAC at three main moments — open / peak / close.
HVAC mattered in real-store operations, yet operators couldn't afford to spend much time on it.

실제 매장 운영 상황에서 도입 가능한 프로덕트를 만들기 위해
유저 퍼소나를 설정하고 유저 저니를 통해 운영자의 상황을 살펴보았습니다

운영자는 크게 오픈 / 피크 / 마감 시점에서 냉난방을 반복적으로 조절하고 있었습니다
또한 실제 매장 운영 환경에서는 냉난방이 중요하지만 운영자가 이에 많은 시간을 쓰기 어려운 상황이었습니다

→ Small business owners needed a structure that's simple and fast to use.

→ 자영업자에게는 간단하고 빠르게 사용할 수 있는 구조가 필요했습니다

[ 03.3 — SOLUTION DIRECTION ]

AI now pre-calculates each choice's outcome
and recommends the most appropriate one.

AI가 각 선택의 결과를 미리 계산해,
가장 적절한 선택을 제안하는 방식으로 전환했습니다.

Based on the current state, AI predicts the outcome of each choice,
compares cost and comfort, and recommends the most appropriate one.

AI는 현재 상태를 기반으로 각 선택의 결과를 예측하고
비용과 쾌적도를 비교해 가장 적절한 선택을 제안합니다.

01

입력 Input

어떤 데이터를 받는가 What data is received

  • 매장의 현재 온도/습도, 외부 기온, 시간대 Real-time store temp/humidity, outdoor temp, time of day
  • 사용자 누적 조작 이력 User adjustment history
  • 전기 요금 구조 (시간대별 단가) Time-of-use pricing structure

02

판단 Judgment

어떤 기준으로 판단하는가 What criteria drive the judgment

  • 비용 가중치 × 쾌적도 가중치 (사용자 모드 설정값) Cost weight × comfort weight (from user mode)
  • 예상 누적 비용 vs 쾌적도 변화 폭 Predicted cumulative cost vs comfort delta
  • 과거 유사 상황의 성공률 Historical success rate in similar contexts

03

출력 Output

어떤 결과를 제공하는가 What output is delivered

  • 3가지 후보 옵션 + 각각의 예상 결과 수치 3 candidate options with predicted outcomes
  • 추천 1순위 + 그 근거 Top recommendation with rationale

[ 03.4 — IDEATION PROCESS ]

We derived features from user stories
and structured them by category.

유저 스토리를 기반으로 기능을 도출하고,
기능별로 카테고리화해 구조화했습니다

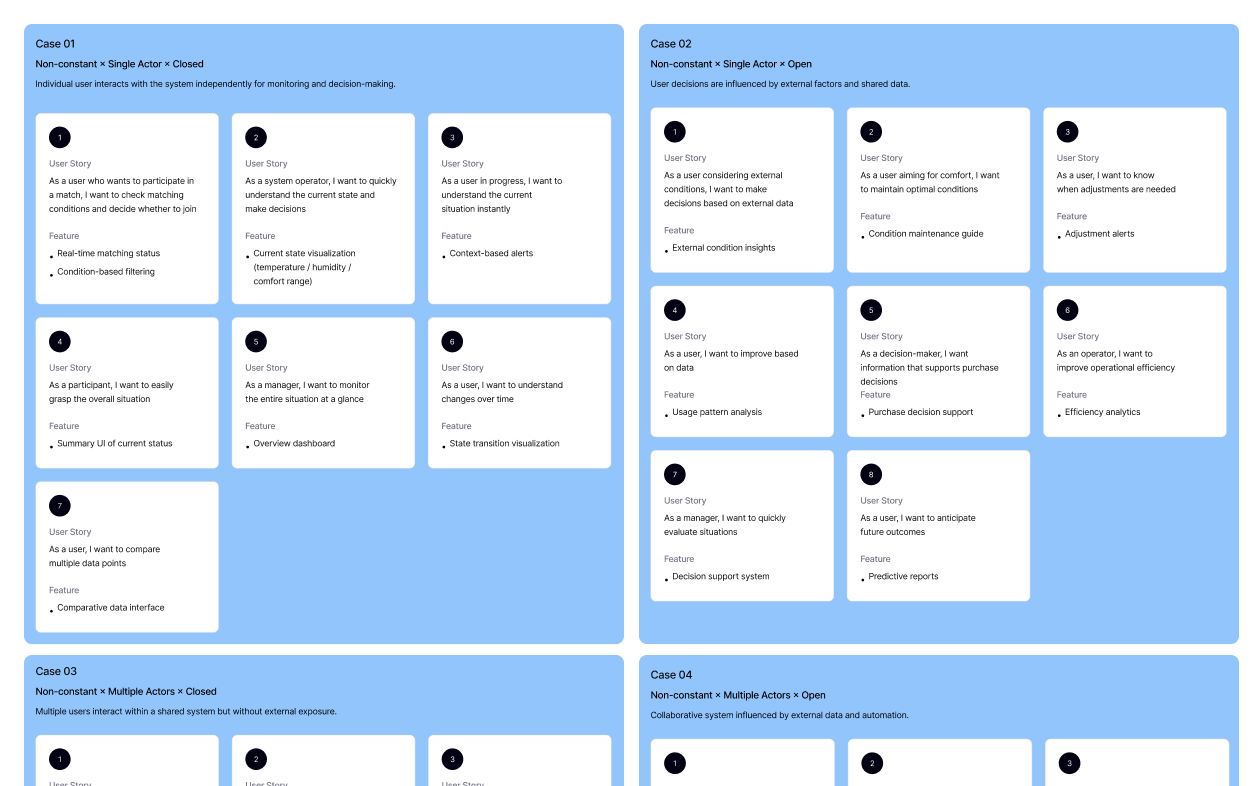
Feature Definition Based on User Scenarios

User stories
User stories 유저스토리
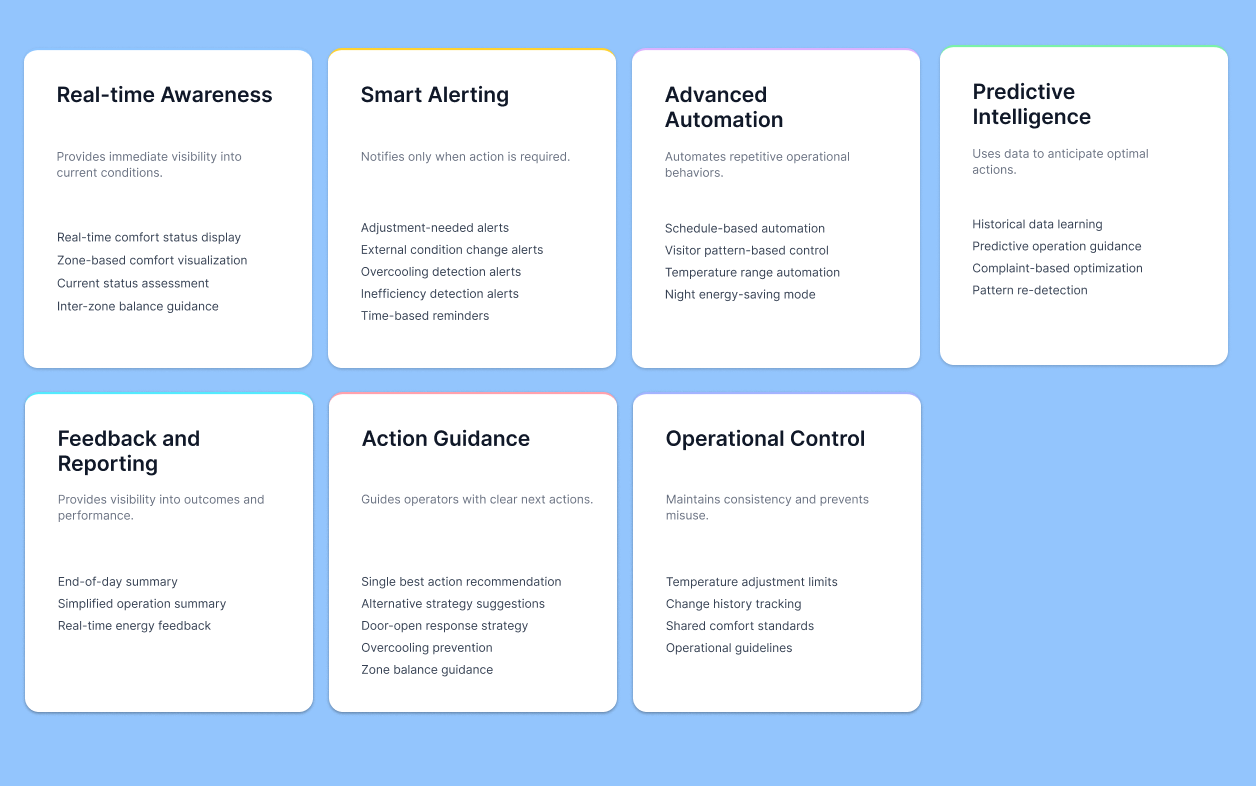
Feature categorization
Feature categorization 기능 카테고리화

We identified each decision point users face during operation,
then split functions into what AI handles automatically versus what stays under user control.

사용자가 매 순간 판단해야 할 결정 지점을 식별하고,
AI가 자동으로 처리할 부분과 사용자가 통제할 부분을 분리해 기능을 정의했습니다

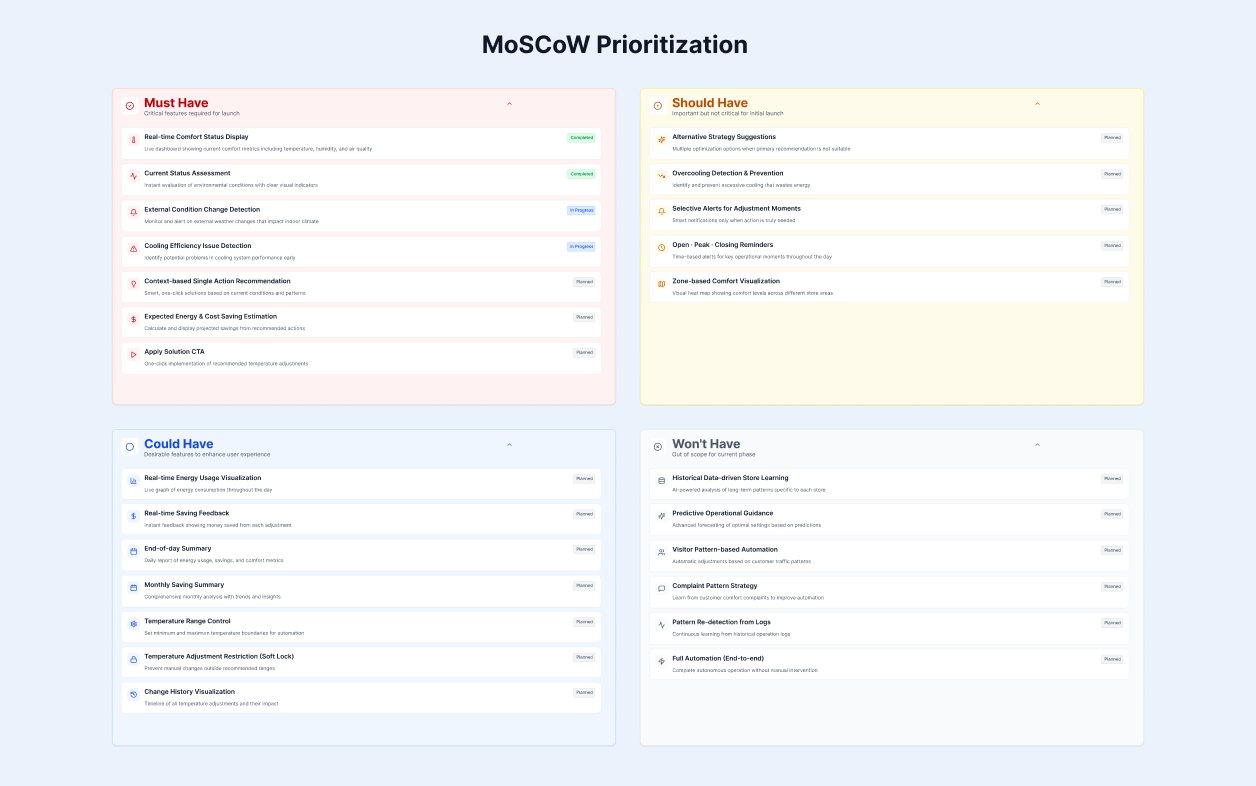
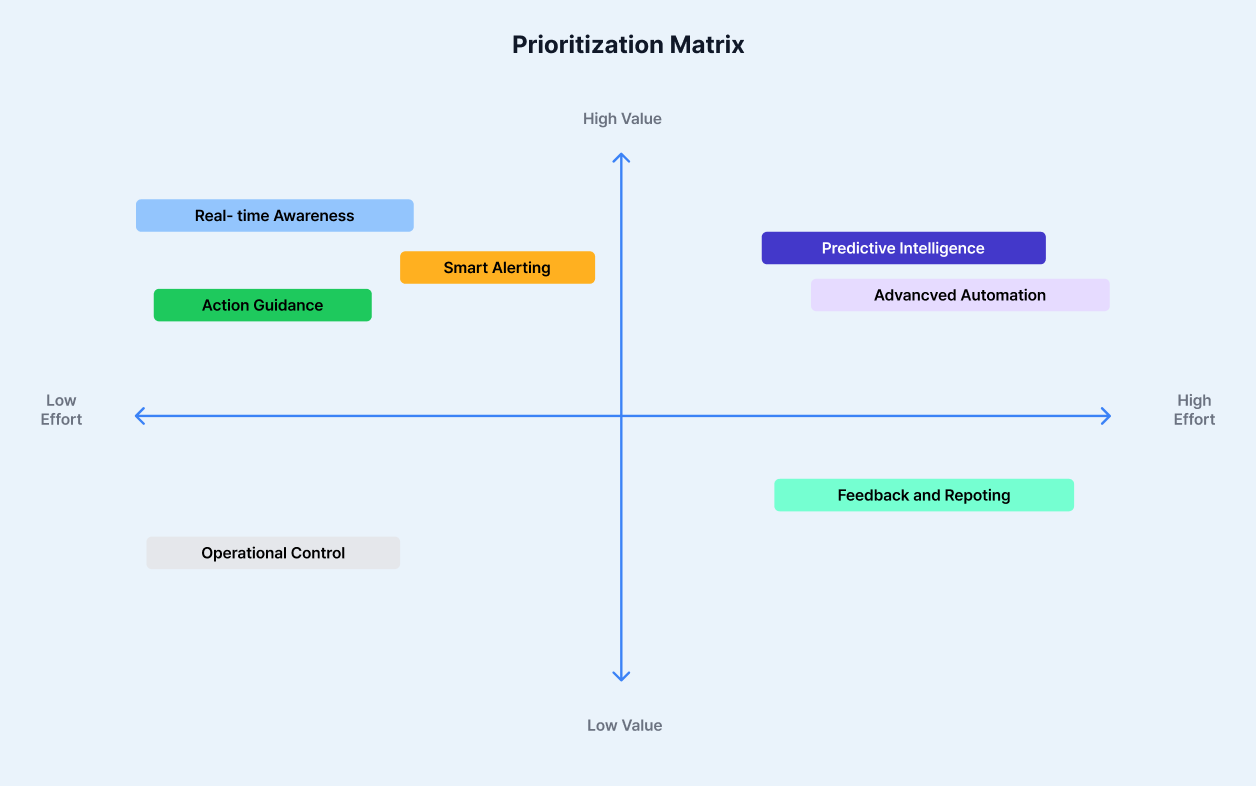
Feature Prioritization

MoSCoW
MoSCoW Moscow
2×2 Matrix
2×2 Matrix 2X2 Matrix

Among the many features, we selected only those required for the MVP based on priority.

다양한 기능 중, 우선순위를 기준으로 MVP에 필요한 기능만 선별했습니다.

[ 03.5 — STRUCTURE DESIGN ]

We designed a structure that lets cost and comfort be compared on one screen,
and selected immediately.

비용과 쾌적도를 한 화면에서 비교하고
바로 선택할 수 있도록 구조를 설계했다

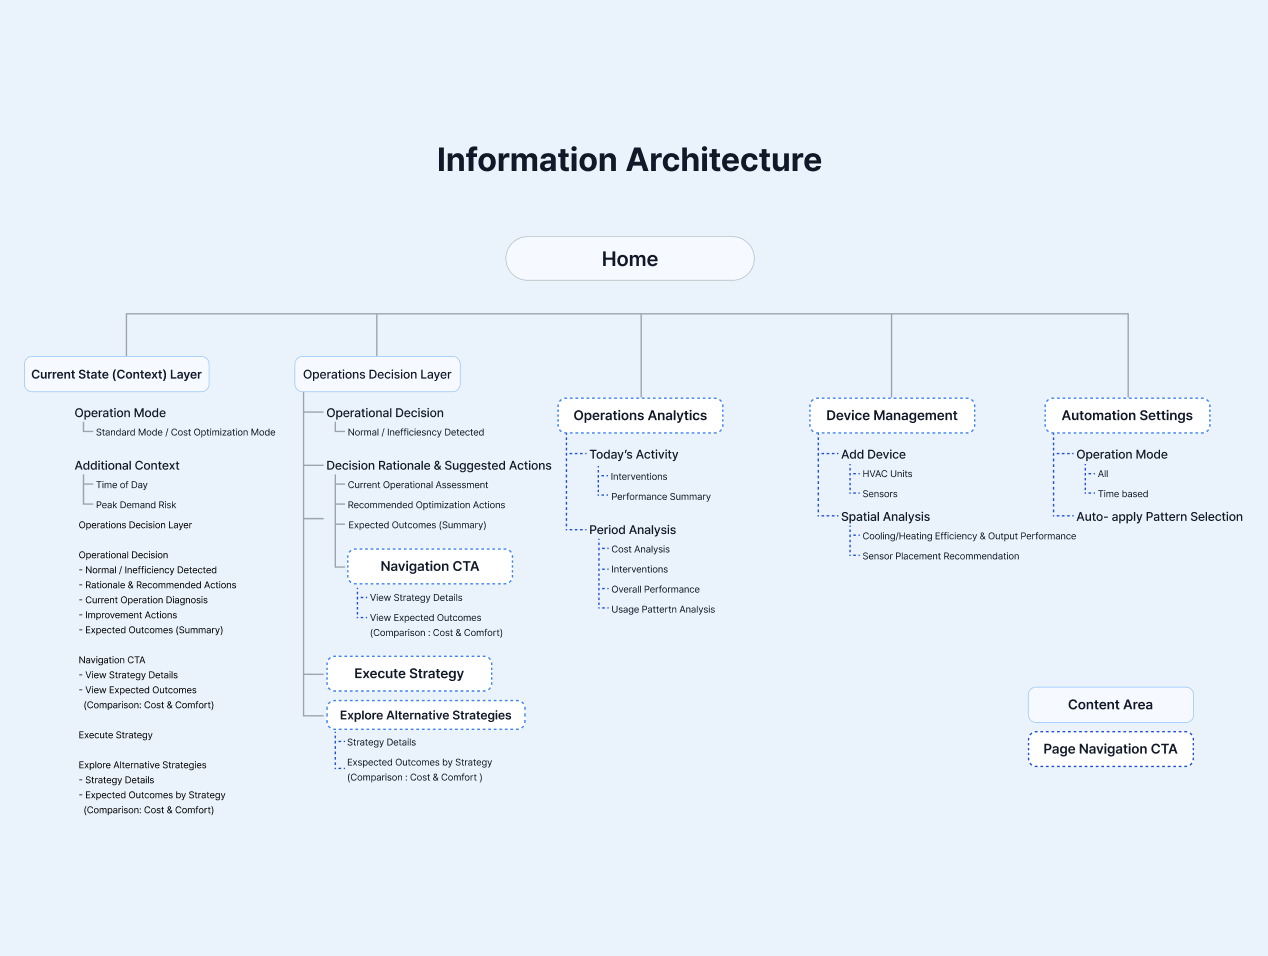
Information Architecture
Information Architecture IA

To let operators compare without navigating away — critical in busy store contexts —
we placed these four data points together on the main screen:

Predicted cost
Cumulative cost
Comfort change
Recommended solution

바쁜 매장에서 화면 전환 없이 동시에 비교할 수 있도록,
아래 4가지 정보를 메인 화면에 함께 배치했습니다

예상 비용
누적 비용
쾌적도 변화
추천 솔루션

→ Designed for fast decisions first, with a discovery layer for when users want to dig deeper.

→ 빠른 결정 중심, 필요 시 탐색하는 구조로 설계했습니다.

Crazy 8 Crazy 8

Interaction Strategy

We determined that most users would handle decisions quickly through pop-up notifications,
and would only navigate to the main screen when they wanted more details about a suggestion
or had specific questions.

대다수의 사용자는 팝업알림을 통해 빠르게 결정을 처리하고,
제안에 대해 더 알고 싶거나 의문이 생긴 경우에만,
메인화면으로 이동한다고 판단했습니다.

→ The main screen needed to be designed for users who want to know more after seeing the pop-up.

→ 메인 화면은 팝업에서 더 알고싶은 유저를 위한 화면으로 설계해야했습니다.

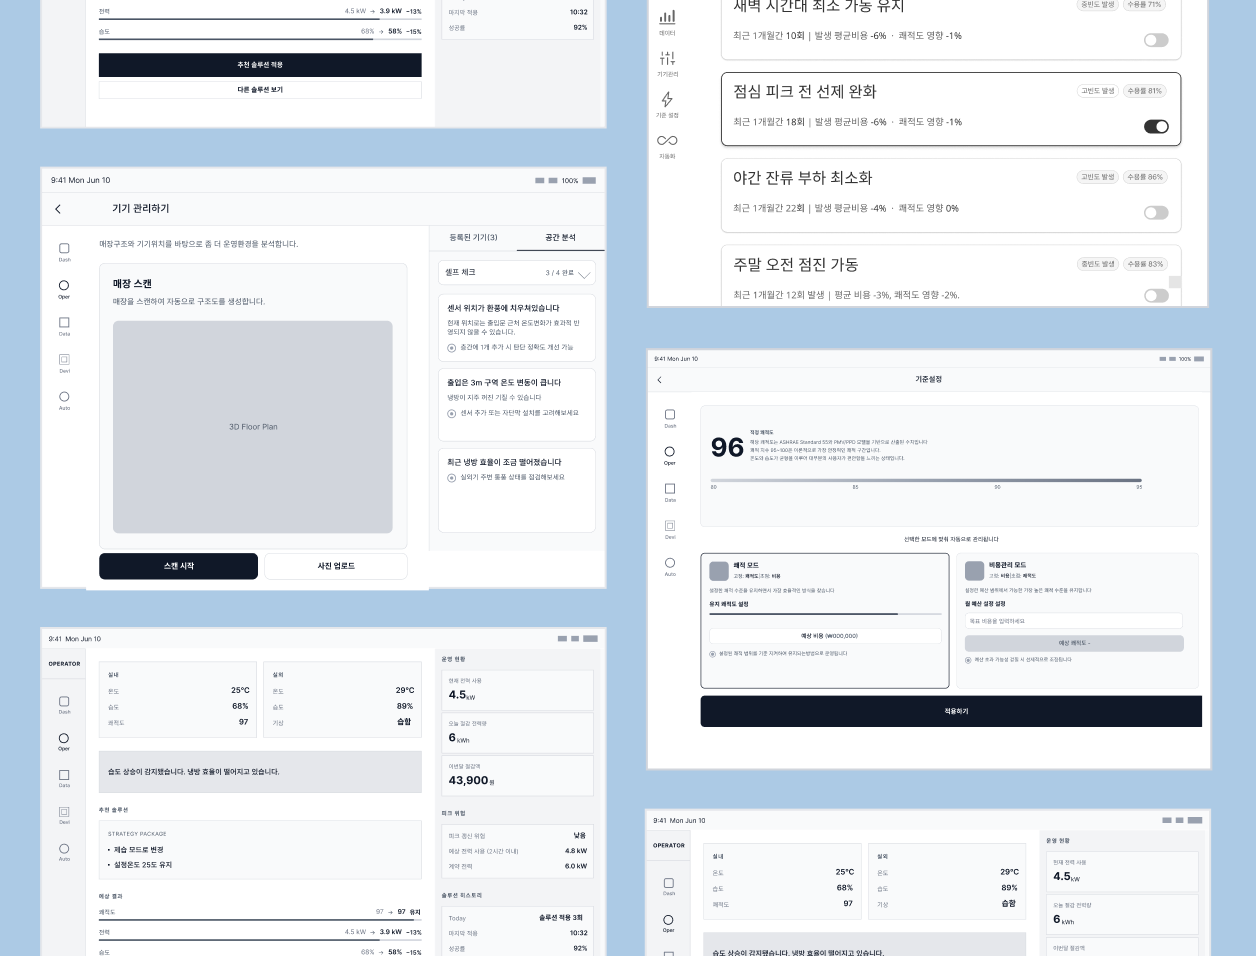
Wireframe
Wireframe Wireframe
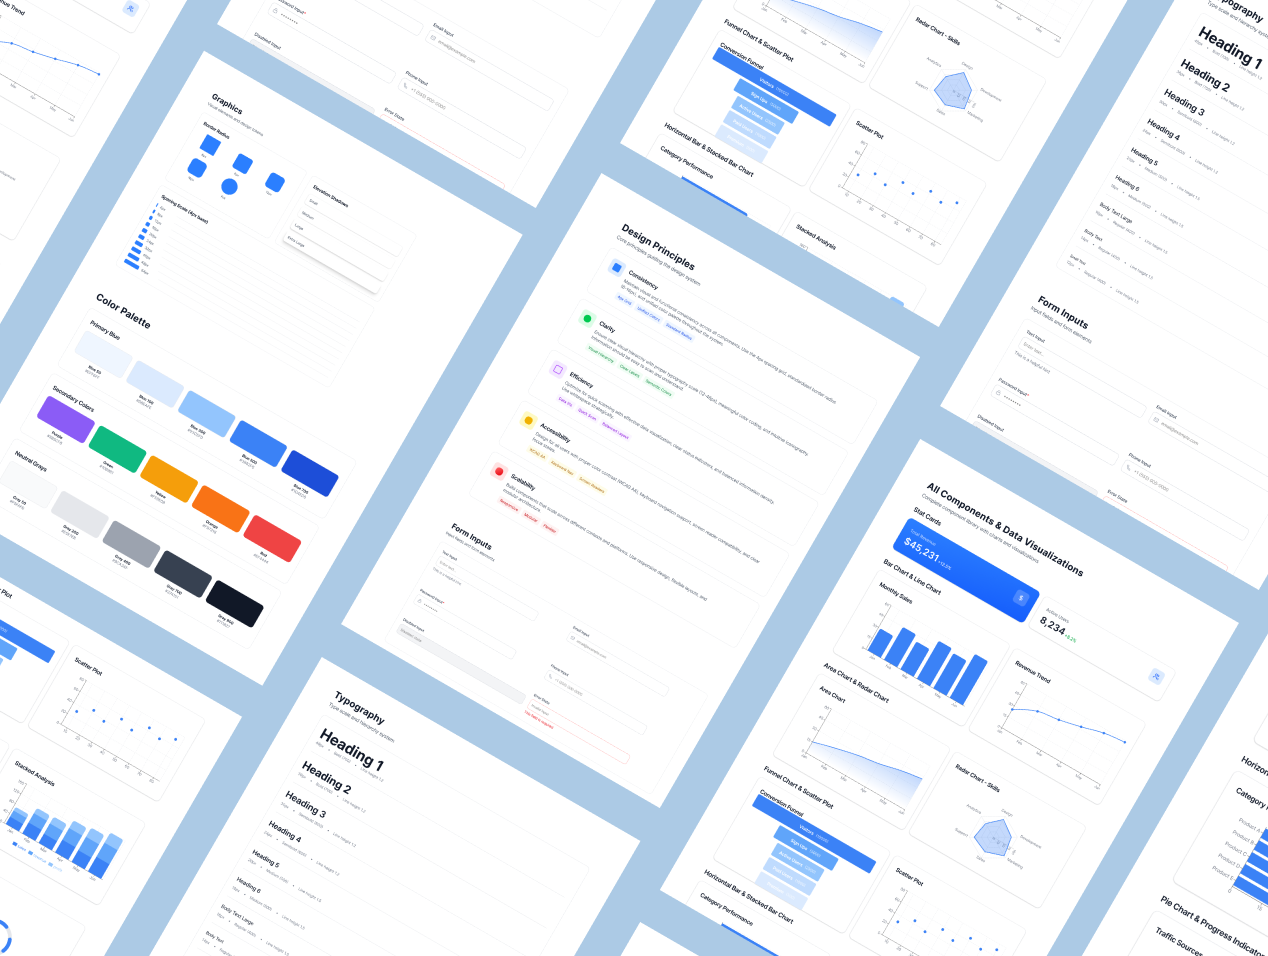
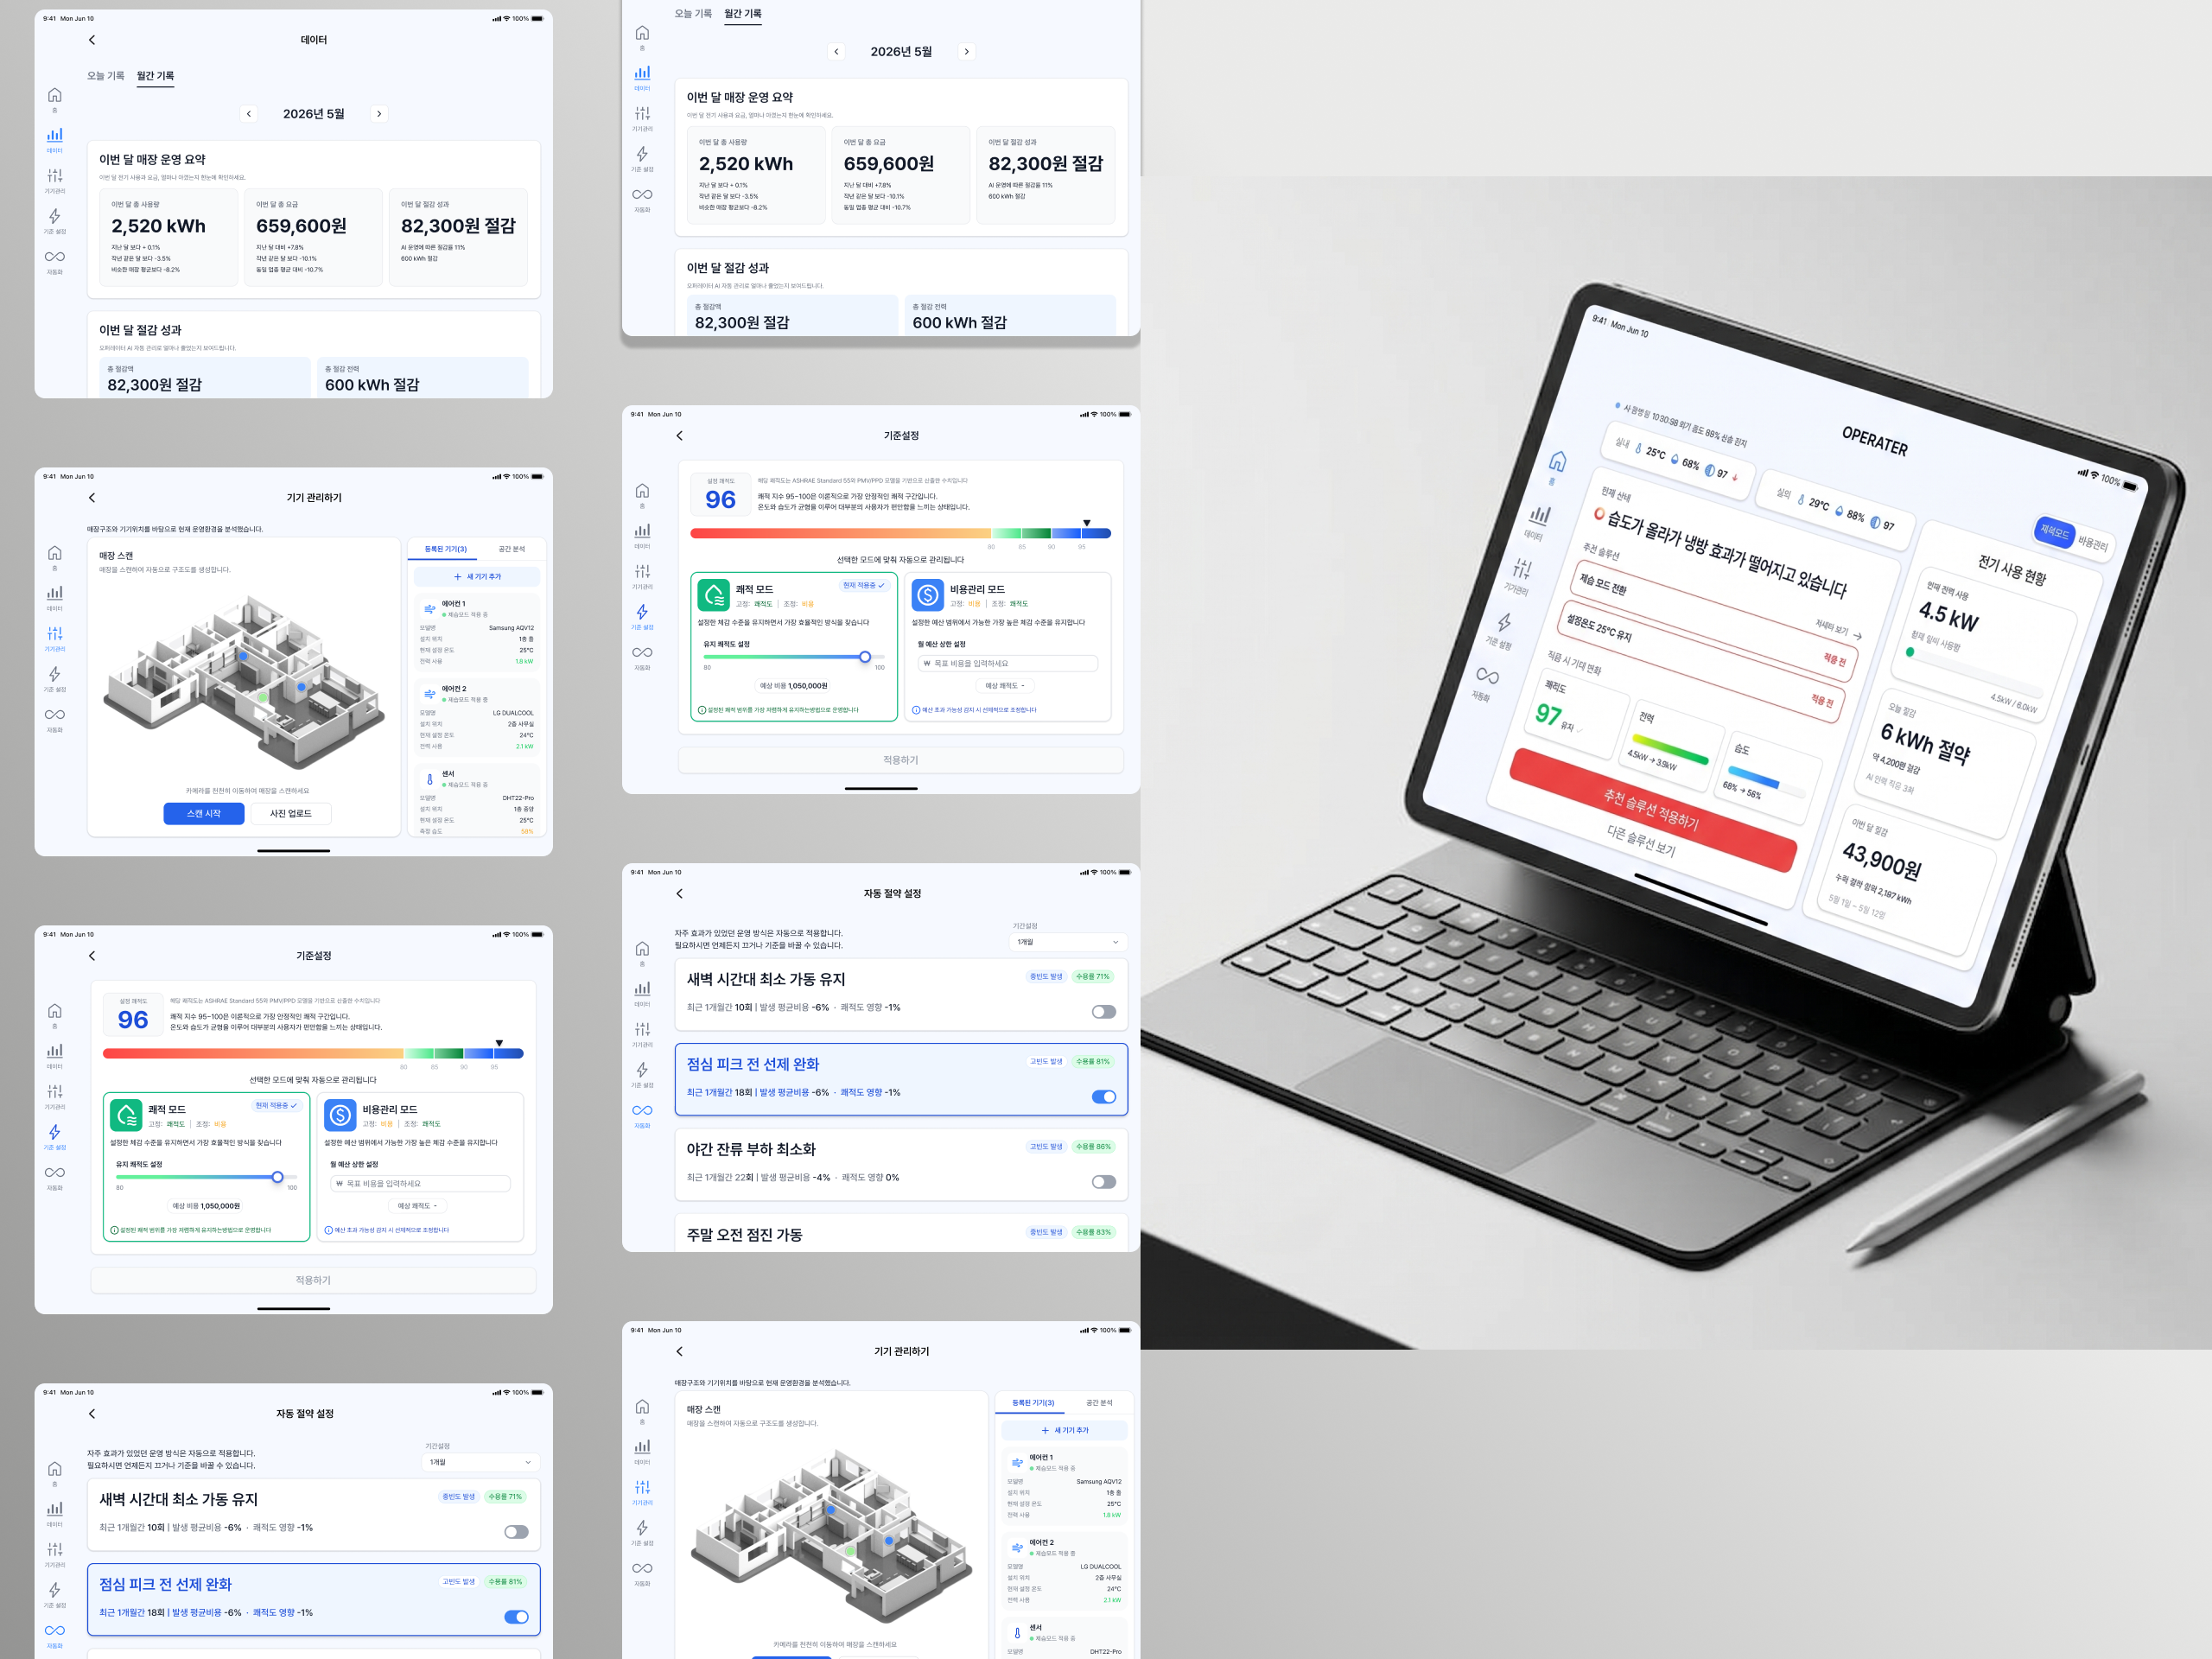
Design system
Design system Design system

We built a visual hierarchy: information that demands recognition within 3 seconds (current cost, comfort)
gets large typography, while supporting data sits smaller beneath it.

3초 안에 인지가 필요한 정보(현재 비용·쾌적도)는 큰 타이포로,
보조 정보는 작게 배치하는 시각적 위계를 설계했습니다

[ 04 — KEY FEATURES ]

FEATURE 01 — INSTANT DECISION VIA POP UP

팝업에서 상태와 추천을
확인하고 바로 적용
Check status & recommendation in the pop-up,
and apply immediately

바쁜 운영 환경에서 사용자는 팝업 알림을 통해
현재 상태와 AI가 제안한 솔루션을 바로 확인하고 즉시 적용할 수 있습니다
In busy operations, users can check the current state and AI's recommendation
through pop-up notifications and apply them immediately.


OUTCOME 10초 안에 빠르게 내리는 결정 Decisions made within 10 seconds

FEATURE 02 — DATA LOG & LEARNING

선택한 결과를 기록하고
학습하는 데이터 로그
A data log that records
and learns from each choice's outcome

AI는 냉난방 조절 이력과 그에 따른 결과를
함께 기록하고 시각화합니다.

사용자는 자신의 선택이 비용과 쾌적도에 어떤
영향을 주었는지 확인 할 수 있습니다.

AI는 누적된 데이터를 학습해
추천 정확도를 점차 개선하고, 이후 결정이
점점 더 쉽고 정확해지도록 돕습니다.
AI records HVAC adjustments along with their outcomes
and visualizes the results.

Users can see how each choice affected
both cost and comfort.

AI learns from the accumulated data to improve
recommendation accuracy over time, so decisions
become easier and more precise.


OUTCOME 비용 변화 + 쾌적도 변화
데이터 시각화
Cost & comfort change
data visualization

FEATURE 03 — MODE SETTING

사용자가 원하는
비용과 쾌적도 기준을 설정하고 운영
Users set their own cost & comfort criteria
and let AI operate within those bounds

모드 설정을 통해 사용자가 비용과 쾌적도 기준을
함께 설정할 수 있습니다

AI는 이 기준을 바탕으로 두 요소를 동시에
만족할 수 있는 운영 방식을 제안합니다
Through mode settings, users can configure
cost and comfort criteria together.

Based on these criteria, AI proposes
an operation strategy that satisfies both at once.


OUTCOME 비용 + 쾌적도 균형 운영 Balanced cost & comfort operation

[ 05 — RESULT & IMPACT ]

[ 05.1 — USABILITY TESTING ]

We tested the decision process in real operating contexts
— 5 participants, 4 tasks

참가자 5명과 4개 과제로,
실제 운영 상황에서의 판단 과정을 테스트했습니다

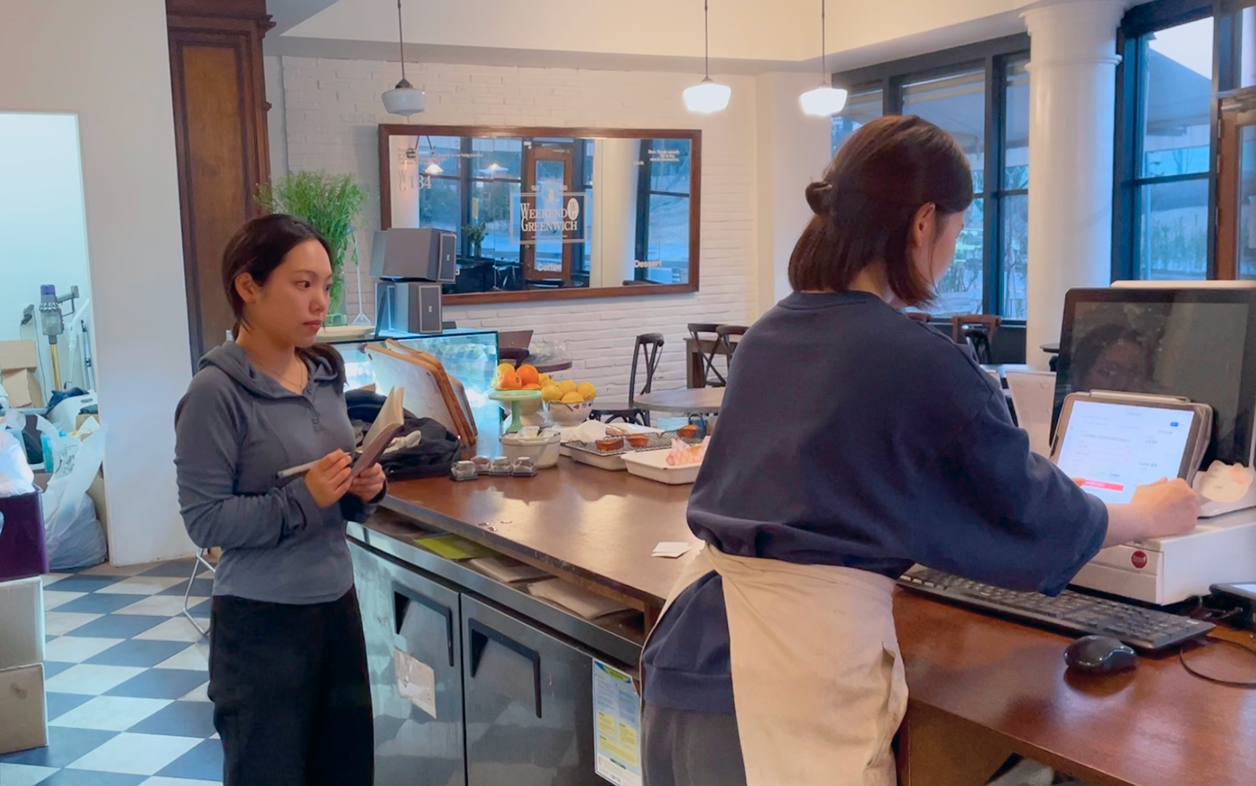
User test photo
UT photo UT사진

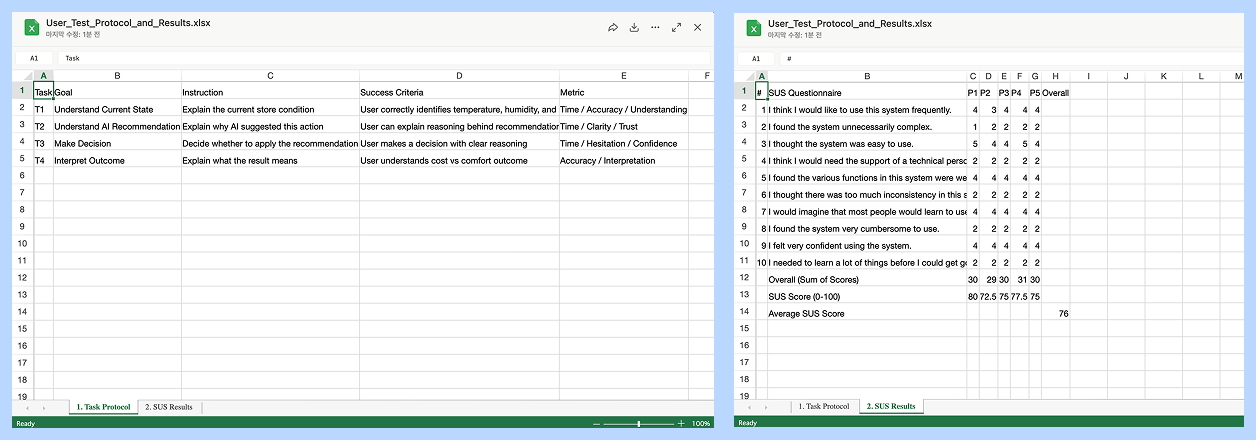
We designed 4 tasks simulating real store operation: ① understand the current store state ② understand why the AI recommended an action ③ decide whether to apply it ④ interpret the cost-comfort outcome.

Each task had defined metrics: time, accuracy, understanding, trust, and hesitation.

실제 매장 운영 상황을 가정해 4개 과제로 테스트를 설계했습니다 — ① 현재 매장 상태 이해 ② AI 추천의 이유 이해 ③ 추천 적용 여부 결정 ④ 결과(비용·쾌적도) 해석.

과제별로 소요 시간, 정확도, 이해·신뢰, 망설임을 측정 기준으로 정의했습니다.

UT protocol
UT protocol UT 프로토콜

01

문제 발생 What went wrong

신규 사용자 5명 중 4명이 첫 매장 등록 단계에서 멈췄습니다. 설정 진입점이 메뉴 깊은 곳에 있어 찾지 못했고, 진입 후에도 시작까지 시간이 오래 걸렸습니다. 4 of 5 first-time users got stuck at store registration. The setup entry was buried in the menu, and even after finding it, getting started took long.

02

원인 Why it happened

첫 화면에서 입력해야 할 항목이 7가지로 인지 부담이 컸고, '비용 모드 / 쾌적 모드' 용어가 직관적이지 않았습니다. The first screen demanded 7 inputs, and the 'cost mode / comfort mode' terms weren't intuitive.

03

개선 What was improved

입력 항목을 3단계로 분할한 온보딩 플로우를 신설하고, 모드 설정에 비용·쾌적 시각 슬라이더를 도입했습니다. We split input into a 3-step onboarding flow and introduced a visual cost-comfort slider for mode setting.

04

개선 후 변화 What changed after

개선안은 필수 입력을 7개에서 3개로 줄인 온보딩으로 재설계했고, 동일 과제 기준으로 재검증을 진행했습니다. The redesign cut required inputs from 7 to 3, and was re-validated against the same tasks.

SUS SCORE

76

SUS(System Usability Scale) 평균 76점 (n=5 · 개별 72.5~80) — 통상 기준선인 68점을 웃도는 수준입니다. 참가자 5명의 탐색적 테스트이므로, 결과는 제품 성과가 아닌 개선 방향을 확인하는 참고값으로 해석했습니다. SUS averaged 76 (n=5 · individual 72.5–80), above the common benchmark of 68. As an exploratory test with 5 participants, we read this as directional input, not product performance.

[ 05.2 — ITERATION ]

We cut required fields to three and added a step-by-step guide,
so first-time setup was designed to finish in under a minute.

필수 입력을 3개로 줄이고 단계별 가이드를 더해,
첫 매장 등록을 1분 안에 끝낼 수 있도록 설계했습니다

ADD SPECIFIC ONBOARDING

쉽게 설정할 수 있는
온보딩 추가
Onboarding flow added
for easier setup

막힌 지점 Stuck

초기 메인 화면에서 '내 매장을 어떻게 등록하지?' 단계에서 멈춤. 설정 진입점이 메뉴 깊은 곳에 있어 5명 중 4명이 발견하지 못했습니다. Users got stuck at "how do I register my store?" on the main screen. The setup entry was buried deep in the menu — 4 out of 5 testers couldn't find it.

원인 Why

한 번에 입력해야 할 정보가 7가지(매장 면적·업종·운영시간·기준 온도 등)였고, "이걸 다 알아야 시작 가능한가?"라는 인지 부담과 거부감이 발생했습니다. Setup demanded 7 inputs at once (area, business type, operating hours, target temp...). The cognitive load made users feel they had to know everything before they could begin.

해결 Fix

필수 3개 항목(업종·면적·운영시간)만 받는 3단계 온보딩으로 분할하고, 나머지 4개는 사용 중 누적 데이터로 AI가 자동 보정하도록 설계했습니다. We split it into a 3-step onboarding that asks only 3 essential items (business type, area, hours). The remaining 4 are auto-tuned by AI from accumulated usage data.


OUTCOME 필수 입력 7개 → 3개 · 3단계 온보딩 신설 Required inputs 7 → 3 · New 3-step onboarding

[ 05.3 — IMPACT ]

Instead of claiming outcomes,
we defined how success would be measured

성과를 단정하는 대신,
무엇으로 성공을 측정할지 정의했습니다

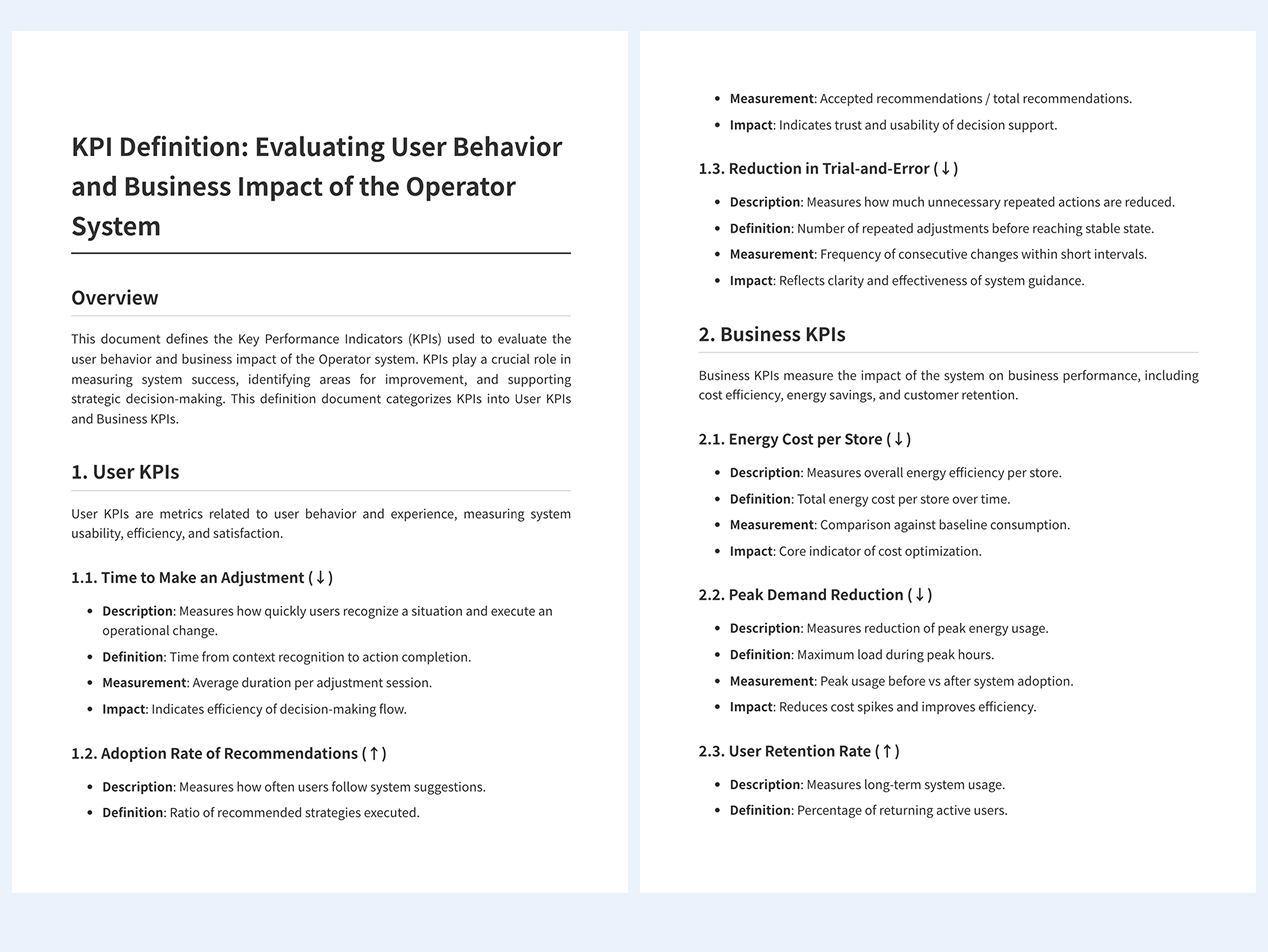
KPI definition
KPI (Key Performance Indicator) KPI (Key Performance Indicator)

A 5-person test can't prove business impact. Instead, we defined the KPIs this system should be measured by if deployed — across user behavior and business performance.

참가자 5명의 테스트만으로 비즈니스 성과를 주장할 수는 없습니다.
대신 이 시스템이 실제 배포된다면 무엇을 측정해야 하는지,
사용자 행동과 비즈니스 성과 양쪽에서 KPI를 정의했습니다.

USER KPIs

  • 판단 소요 시간 ↓
    상황 인지부터 조작 완료까지의 시간. 의사결정 흐름의 효율 지표
    Time to make an adjustment ↓
    From context recognition to action — efficiency of the decision flow
  • 추천 수용률 ↑
    전체 추천 중 실제 실행된 비율. AI 판단에 대한 신뢰의 직접 지표
    Adoption rate of recommendations ↑
    Executed ÷ total recommendations — the direct measure of trust in AI judgment
  • 반복 조작 감소 ↓
    안정 상태 도달까지의 재조정 횟수. 기준 제공이 불안을 줄였는지의 지표
    Reduction in trial-and-error ↓
    Repeated adjustments before reaching a stable state

BUSINESS KPIs

  • 매장당 에너지 비용 ↓
    기준선 대비 총 에너지 비용. 비용 최적화의 핵심 지표
    Energy cost per store ↓
    Total energy cost vs baseline — the core cost-optimization metric
  • 피크 수요 감소 ↓
    피크 시간대 최대 부하. 도입 전후 비교
    Peak demand reduction ↓
    Max load during peak hours, before vs after
  • 리텐션 ↑
    재방문 활성 사용자 비율. 장기 유용성 지표
    User retention rate ↑
    Returning active users — the long-term usefulness metric

이 중 가장 먼저 확인할 지표는 추천 수용률입니다.
사용자가 AI의 제안을 실제로 따르는가 — 이것이 '판단을 대신해주는 시스템'이라는
이 제품의 가설을 검증하는 첫 번째 증거이기 때문입니다.
The first metric to watch is adoption rate — whether users actually follow
the AI's suggestions is the first proof of a system built to judge on their behalf.

[ 06 — REFLECTION ]

I had lived this problem —
so I solved it with validation, not conviction

직접 겪은 문제였기에,
확신 대신 검증으로 풀었습니다

01

운영자였던 경험은 출발점이었지만, 근거는 아니었습니다 Being an operator was a starting point, not evidence

매장을 운영하며 직접 겪은 문제라 문제 정의는 빨랐습니다. 하지만 내 경험을 근거로 쓰는 대신 가설로 두고, 커뮤니티 데이터·인터뷰·요금구조 분석으로 검증했습니다. 개인 경험은 방향을 주지만, 그것을 일반화하지 않는 것이 더 중요했습니다. Having run a store, I defined the problem fast. But I treated my experience as a hypothesis, validating it with community data, interviews, and pricing-structure analysis. Personal experience gives direction; not generalizing it mattered more.

02

직접 계산해보니 처음 방향이 틀렸고, 그래서 바꿀 수 있었습니다 Calculating it myself proved the first direction wrong — and that's why I could change it

요금구조만 활용하면 될 것이라는 가설을 시나리오로 직접 계산해 확인했습니다. 절감 효과는 작았고 쾌적 기준과 충돌했습니다. 이 반증 덕분에 비용 1축이 아닌 비용·쾌적 2축 판단으로 방향을 바꿀 수 있었습니다. 검증은 아이디어를 버리게 하는 것이 아니라, 더 나은 방향을 줍니다. I tested the 'pricing structure alone' hypothesis with scenario calculations. Savings were small and clashed with comfort. That refutation enabled the shift from a single cost axis to judging cost and comfort together. Validation doesn't kill ideas — it gives better directions.

03

성과를 주장할 수 없을 때, 측정을 설계하는 것도 디자이너의 일이었습니다 When you can't claim outcomes, designing the measurement is also the designer's job

컨셉 프로젝트라 비즈니스 성과를 증명할 수는 없었습니다. 대신 무엇으로 성공을 판단할지 KPI를 정의했고, 그 첫 번째가 추천 수용률입니다. 숫자를 만들 수 없다면, 숫자를 잴 방법을 만드는 것이 정직한 결론이라고 생각했습니다. As a concept project, business impact couldn't be proven. So I defined the KPIs success should be judged by — starting with adoption rate. If you can't produce the number, building the way to measure it is the honest conclusion.

이번 리서치는 인터뷰 5인, 사용성 테스트 5인의 탐색적 결과로, 발견된 패턴을 시장 전체로 일반화하지 않았습니다. This research is exploratory — 5 interviews and a 5-person usability test. We did not generalize the patterns to the whole market.